Frequently Asked Questions
Simple definitions
may be found in the glossary. For questions
relating to the Current Marine Observations
page, please click here. For all other inquiries or for
more information please contact oceanwx@oceanweather.com.
What is the averaging interval of Oceanweather (OWI) winds?
How do I get cos^n or cos^N from ANGSPR or INLINE?
How does OWI compute peaks for sector extremes?
Why isn't there one sector extreme at 100%?
Can a sector extreme exceed 100%?
Why can an associated variable in the sector extremes
of another peak variable exceed the extremes for the same sector when it is the
peak variable in a different table?
What is the difference between HCrest (or HCrestF) and HMax in
OWI extremes tables?
Should I use DMDIR (dominant direction) or VMD (vector mean
direction)?
How are islands resolved in the Oceanweather wave models?
What are some reasons why my measurements do not exactly
match Oceanweather's hindcast?
Is the integrated spectral band in Oceanweather's OWI3G
model included in the calculation of moments (MO1 and MO2)?
Is the integrated spectral band in Oceanweather's
application of the WW3 model included in the calculation of moments (MO1 and MO2)?
What is the reason for the shape including the tail
in a scatter plot of significant wave height (HS) vs. peak period (TP)?
How do I compute wave height (HS) sea (HSSea) and
swell (HSSw) splits from an OWI wave model hindcast?
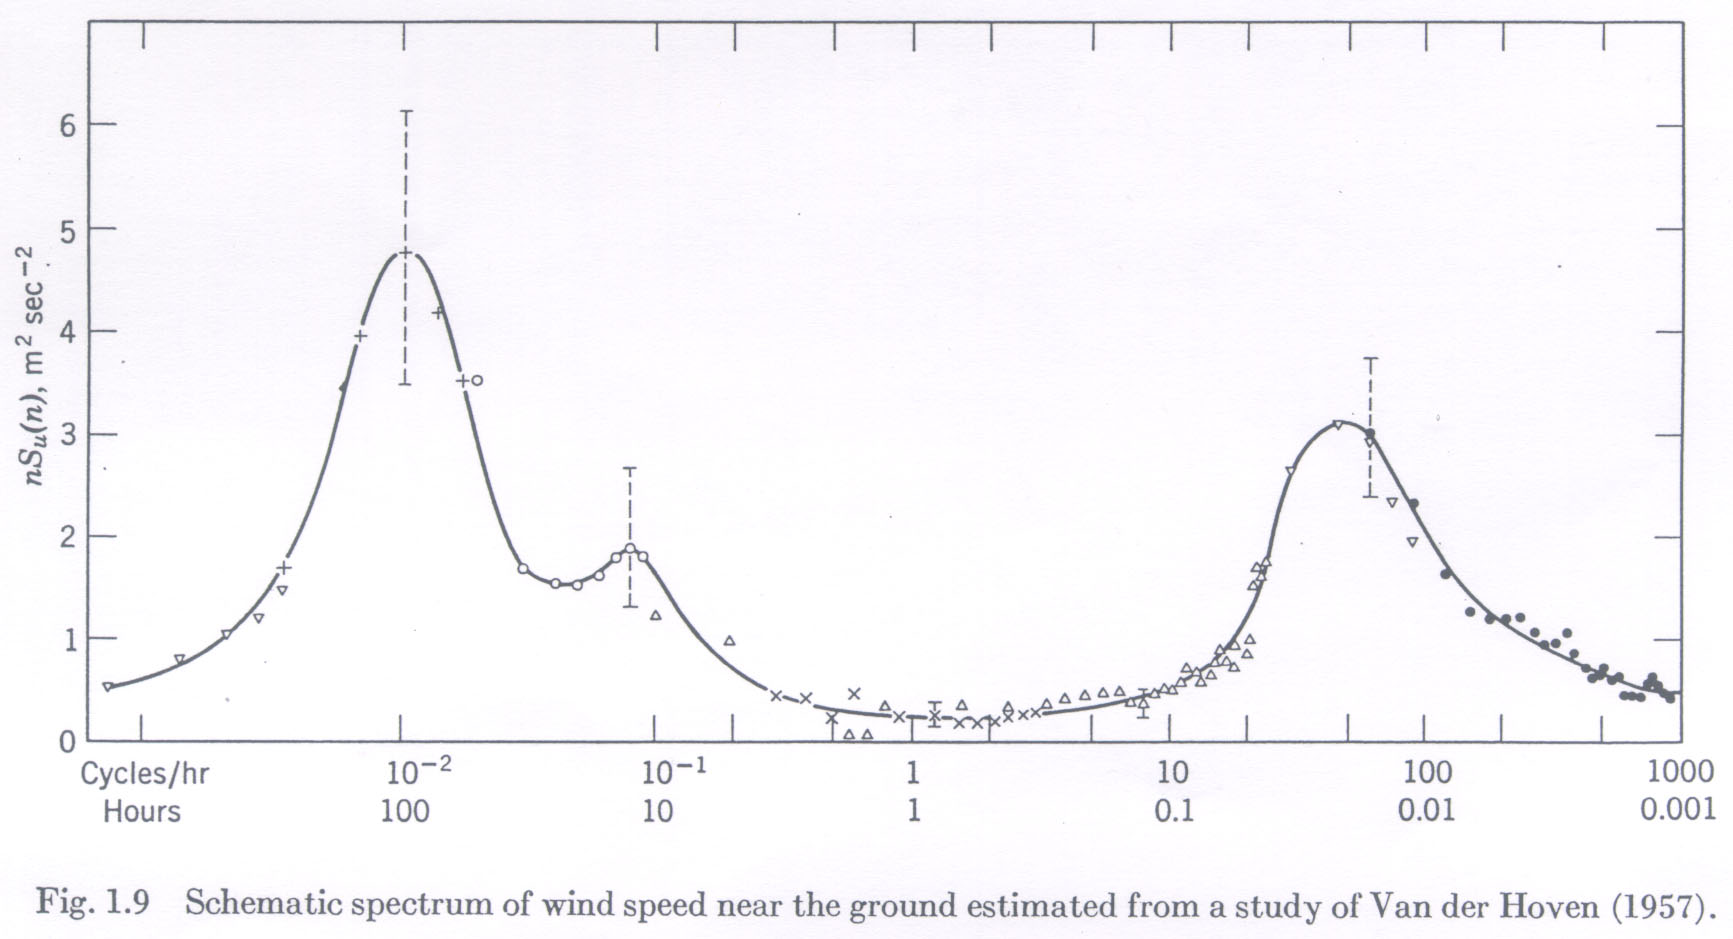
What is the averaging interval of
Oceanweather (OWI) winds?
The model
wind speeds OWI produce and use can be considered to be representative of "mean"
winds for any averaging period between 10-minute and 3-hours based on the
statistical similarity of wind speed averages under normal conditions for
any window within those mesoscale-gap time scale(s). Numerical meteorological
models compute (average) wind velocities based on forcing and boundary data
developed on a variety of timescales in addition to assimilation of
observations/measurements that employ numerous averaging periods (i.e. 2-minute,
10-minute and 20-minute period). This results in model winds that are
representative of mean winds consistent with any averaging period within the
10-minute to 3-hour set of time scales (the mesoscale-gap, see figure below).
Harper
et. al. 2010
describes mean wind speeds for shorter averaging periods in the context
of wind speed measurements with the following language, which is consistent
with the assumption OWI operates under for the representativeness of model winds:
"Although
any period of time can be chosen for averaging the wind speed, shorter periods of
averaging will typically produce more erratic values than the 10-min average.
For example, ten 1-min averages taken during a 10-min period will produce values
that lie both above and below the 10-min mean value. Any single 1-min random
sample is an equally valid (unbiased) estimate of the mean wind but it is likely
to be higher or lower than the true mean wind. Hence, while one estimate of
the mean wind is (statistically) as good as another, in practice, mean winds
measured over shorter periods will possess greater variance and will
therefore be "less reliable". Alternatively, if there was no turbulence in
the wind, then all averaging periods would yield the same true mean wind speed."
"...the
difference between 1-s, 3-s, 1-min and 10-min observed means is solely that
the longer averaging period leads to the sample mean being a more accurate
estimate of the true mean. Provided that the sampling is random, the expected
values for each averaging period are equal, and individual realizations will
be both greater and less than the true mean. Note however that if a 10-min
sample is subdivided into ten 1-min samples, the mean of each calculated, and
the largest of these 1-min means is chosen, then this is no longer an unbiased
estimate of the true mean, since the sampling is not random. Such a measurement
is, in fact, termed a gust..."
How do I get cos^n or cos^N from ANGSPR or
INLINE?
Angular
spreading (ANGSPR) and the in-line variance ratio (INLINE) are related to cos^n(q)
spreading as follows: n = (2*ANGSPR)/(1-ANGSPR) or alternatively as n =
((2*INLINE^2)-1)/(1-INLINE^2). ANGSPR and INLINE are measuring different aspects
of directional spreading and therefore will give different answers for n, both
of which are approximations because OWI's wave model is computing ANGSPR and
INLINE directly from the wave spectra at each archived step. ANGSPR is based
on the circular standard deviation while INLINE is based on the trigonometric
second moments (see OWI Field Variable Definitions)
and because different types of storms have varying directional spectra (think tropical
cyclone vs. broad extratropical storm vs. a monodirectional monsoon) there won't be a
direct relationship between ANGSPR and INLINE. There are two cosine formulas for n
and N: n in cos^(2n)(theta/2) and N in cos^N(theta), which are derived by matching their
moments with those that went into finding ANGSPR or INLINE. Therefore, n and N
calculated from ANGSPR or INLINE should not be expected to be equal. Most people
use cos^(2n)(theta/2) because cos^N(theta) is negative over half the circle and
truncating it is awkward mathematically so it is usually confined to [-pi/2,
pi/2]. If the object is to calculate drag forces on a platform or other fixed
structure, INLINE gives the orbital velocity reduction directly. (Source:
George Forristall, personal communication)
How does OWI compute peaks for sector
extremes?
First, all
of the peaks in a time series are identified for a specific metocean parameter.
This is the time step where the adjacent values are lower. Next, the time series
surrounding the peak are examined to find values that continue to be the same or
lower than the peak that are part of the same event. Once the time series starts
increasing again the event is over. This window of time series is then inspected
to see if the metocean parameter falls within any of the defined sector bins,
retaining the highest value in that sector. Obviously, the peak value itself
will fall into one of the sectors, and if the direction doesn't change very
much during the time series window, it is possible that some sectors will have
no values for that event. The process is repeated for all of the peaks to
create a set of sector peak tables. Afterward, a threshold (e.g. TopN or
Half Maximum) is applied to each set of sector peaks and the extremes are
computed for each sector.
Why isn't there one sector extreme at
100%?
If
the extremes are site-averaged (true for tropical cyclone extremes), then it
is pretty difficult to end up with a site-averaged sector of 100%. It would
require each of the site-average points to all have an extreme value at 100%.
If even just one single point falls below 100%, then the site-average will be
below 100% because all of the grid points in the site-average are given equal
weight.
If
the extremes are not site-averaged, which is true for extratropical/winter
storm extremes, then it is more likely to see a sector at 100% but it is still
not guaranteed. OWI's sector methodology is to look around the peak of an
event and then take the highest value in a sector range (see question above).
Since the top value within the time window can only be assigned to a single
sector, the other sectors will naturally contain lower values (or in a rare
instance a tie).
In
some places with unidirectional flow like the central Caribbean, waves (or
winds) from the west are nearly never observed, so the omni-directional
population and the easterly population will have significant overlap and
there's a much higher chance to have a sector extreme that gets to
100%.
Can a sector extreme exceed 100%?
No,
the value is capped to 100% prior to site-averaging. OWI does not allow any
sector extreme to exceed the omni-directional answer.
Why can an associated variable in the
sector extremes of another peak variable exceed the extremes for the same
sector when it is the peak variable in a different table?
For example,
the 100-year associated current speed, CS, (at the time of maximum
significant wave height, HS) for the south sector is 25 cm/s, but the
100-year maximum current speed for the south sector is only 15 cm/s.
And for reference, the omni-directional 100-year maximum current speed is
30 cm/s.
OWI
applies the ratio of the omni-directional HS to the sector HS to the
omni-directional CS to determine the associated sector extremes. This
implies that the current directions can come from anywhere in the compass.
When CS is the peak variable, the south sector is probably an unlikely
sector, potentially caused by the alignment of the depth contours (currents
like to flow in-line with the depth contours, not perpendicular to them,
especially in shallow water). The highest CS sector values are lower than
the omni-directional CS peaks, so that is why the south sector extremes are
just 50% of the omni-directional answer.
What is the difference between HCrest (or HCrestF)
and HMax in OWI extremes tables?
HCrest
is the individual crest height of the wave as described in Haring and Heideman,
1978. HCrestF is the same definition but uses the method described in
Forristall, 2000.
HMax is the maximum individual wave height as described in
Forristall,
1978 and will always be higher than HCrest and HCrestF. Physically speaking,
the crest is the height of the top of the wave above the still water line and maximum
individual wave is the height from the trough to the crest of the wave. See
this link for the equations. Mackay 2018 gives a
comprehensive description for calculating return period extremes similar to
OWI's method.
Should I use DMDIR (dominant direction) or VMD (vector
mean direction)?
How are islands resolved in the Oceanweather wave
models?
It
takes two land points to resolve an island in OWI's wave models and block
the wave energy from passing through. For example, if the two grid points
are oriented east-west, then some energy may "get through" the grid points
to the north and south when the waves are oriented north-south. This energy
will be blocked when the waves are oriented east-west.
What are some reasons why my measurements
do not exactly match Oceanweather's hindcast?
In no
particular order here are some reasons why the measurements do not exactly
match OWI's hindcasts: (1) grid resolution - there's some underwater feature
that alters the direction of the waves or induces a current that interacts
with the wave energy, (2) distance between nearest OWI archived hindcast
point and measurement site is far enough away that the conditions seen in
each location are just different, (3) if the water depths vary dramatically,
it is possible that the waves are breaking before or at the measurement site,
(4) the measurement site is over land and the winds are experiencing more
friction than if the winds had an open-water exposure.
Is the integrated spectral band in
Oceanweather's OWI3G model included in the calculation of moments (MO1
and MO2)?
Yes.
This energy is already folded into the last energy band before the
calculation occurs.
Is the integrated spectral band in
Oceanweather's application of the WW3 model included in the calculation
of moments (MO1 and MO2)?
No.
This energy is dropped; however, OWI typically runs the WW3 model with more
frequency bands than the OWI3G model to better resolve these higher
frequencies.
What is the reason for the shape including
the tail in a scatter plot of significant wave height (HS) vs. peak
period (TP)?
See
the sample figure below of a grid point located in a region where light winds,
very low wave heights, and short periods can occur simultaneously. The period
and wave pairs make a little line (tail) on the left as a direct result of the
parabola fitting of the 23rd frequency bin in the OWI3G wave model. The
highest bin (bin number 23) is an integrated bin which simulates the energy
in the range of 0.3065 Hz to 2.52741 Hz. The default loop of the TP fitting
algorithm, when it suspects that the true TP is between bin 22 and 21 (in which
case it cannot fit a parabola), is to simply take an average of the inverse of
the center frequencies of bins 22 (0.2922 Hz) and 21 (0.2655 Hz). It will
generally happen with light winds and not a lot of energy (hence the low wave
heights associated with it). The rest of the plot generally looks like a shark
fin where there's a peak HS associated with some period (9.5 m / 13 s at this
location). Grid points in wide open water with constant background swell may
not experience calm conditions to see the tail feature in the plot, but will
still have a shark fin shape (say mid-Atlantic near the equator) or have a
double hump (say in the midlatitudes of the North Atlantic Ocean) for peak
wave paired with both a medium period (local wave generation) and a long period
(swell).
How do I compute wave height (HS) sea (HSSea) and
swell (HSSw) splits from an OWI wave model hindcast?
To
partition sea (primary) and swell (secondary) we compute a P-M (Pierson-Moskowitz)
spectrum, with a cos^3 spreading, from the adopted wind speed and direction.
For each of the spectral bins, the lesser of the hindcast variance component
and P-M variance component is thrown into the sea partition; the excess, if
any, of hindcast over P-M is thrown into the swell partition. The sea and
swell partitions are typically provided as variances (ETTSea, ETTSw), periods
(TPSea, TPSw), and wave direction (VMDSea, VMDSw) within the time series. To
compute estimates of these partitions for HS you can do the following:
Knowing
that HS = 4*sqrt(ETTSea+ETTSw), HSsea = 4*sqrt(ETTSea) and HSswell = 4*sqrt(ETTSw).
HS = sqrt(HSSea^2 + HSSw^2).
However,
please keep in mind the square root of sea and swell squared are approximations
only. The best way is to use the spectra to split the sea and swell properly.
But this will suffice if only requiring estimates.
Have a different question?
Please contact: oceanwx@oceanweather.com